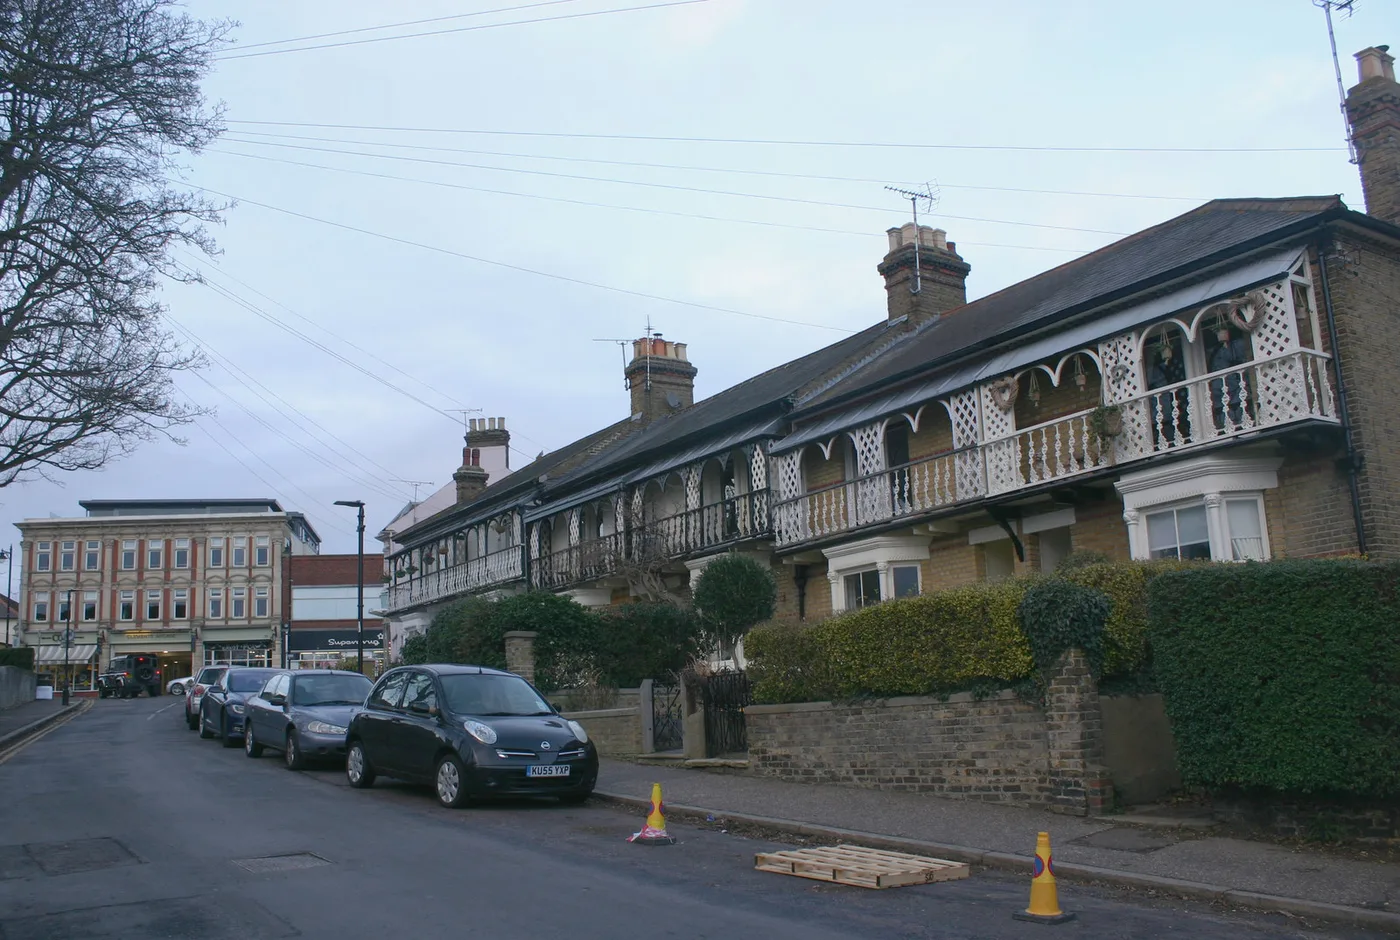

The average Southend home sold for £328,383 in July 2026, up £5,221 on the year, while flats fell. What houses and flats cost, Thorpe Bay to Southchurch.
If you live in Southend, or you are trying to buy here, the question is always the same: what do homes actually sell for right now? Asking prices in agents’ windows tell you what sellers hope for. The figure that matters is what properties genuinely change hands for, and that is recorded by HM Land Registry once every sale completes. This is a plain read of those numbers for 2026: the average price, which way it is moving, what you pay by property type, how Leigh-on-Sea and Thorpe Bay compare with the city centre and Southchurch, and how Southend sits against the East of England and the country.
The headline figure for 2026
The average home in Southend-on-Sea sold for £328,383 in July 2026. That is the provisional figure from the official UK House Price Index, which is built from completed Land Registry sales rather than asking prices, and it is £5,221 more than the £323,162 average of a year earlier, a rise of 1.6%.
Two lines of honesty go with that. The average is still £2,617 below its February figure of £331,000, so the market has not made back everything it lost in the spring. And the Land Registry revises: February has since been restated £418 higher and June £437 lower than the figures published a month ago (UK House Price Index). We set out the fuller picture, including how Southend compares with the other 13 Essex districts, in our report on the July 2026 figures.
A note on the other numbers you will see. Plumplot quotes a Southend average around £382,000 and PropertySolvers about £373,771. Neither contradicts the £328,383. Those are simple averages of every sale price over the past twelve months, which larger detached sales pull upward, while the UK House Price Index adjusts for the mix of homes actually sold. Always check what a figure measures before you compare it with another one.
What it means for you
If you are selling a house, the market has moved your way: semis are up 3.1% and terraces 2.9% over the year. If you are selling a flat, be careful, because flats are the only Southend property type worth less than a year ago. If you are buying a flat, you are in the softest corner of the market and have more room to negotiate than house buyers do. Whatever you view, check its council tax band first, because that yearly bill is a running cost many buyers only discover after the offer.
Prices by property type
The headline average hides a wide spread. These are the Southend averages for July 2026 from the UK House Price Index, with the change over twelve months:
- Detached houses: £644,057 (up 2.1%). The big family homes of Thorpe Bay, Chalkwell and Leigh command the premium.
- Semi-detached houses: £430,009 (up 3.1%, the strongest of the four types).
- Terraced houses: £334,776 (up 2.9%). Sitting almost exactly on the city average.
- Flats and maisonettes: £198,797 (down 0.8%, the only type to lose value over the year).
All four rose on the month: detached and terraced by 1.1% each, semi-detached by 1.0% and flats by 0.8%.
First-time buyers and home movers
The same data splits buyers usefully. A first-time buyer in Southend paid an average of £270,596 in July 2026, up 1.6% on a year earlier. A home mover, someone selling one property to buy the next, paid an average of £419,008, up 1.8% (UK House Price Index). The £148,412 gap between the two is the size of the step from a first flat or terrace to a family house here.
Leigh-on-Sea, Thorpe Bay and the rest: prices by area
Southend is really several markets in one postcode area. Based on sold prices over the year to 30 April 2026 compiled by Rightmove:
- Thorpe Bay is the priciest corner, with an overall average of £584,903 and detached homes at £716,051. Rightmove notes prices there are still about 7% below their 2023 peak.
- Chalkwell averages £470,085 overall, but its detached homes top the city at £1,142,045.
- Leigh-on-Sea averages £442,028, with semis at £485,537, and sits about 3% below its 2022 peak.
- Central Southend (the SS1 and SS2 core) averages £351,110, with flats at £213,162.
- Southchurch averages £313,875 and is the growth story, up 7% on the previous year and 5% above its 2023 peak.
The pattern is the reverse of the boom years: the premium western and eastern ends, Leigh, Chalkwell and Thorpe Bay, are still trading below their 2022 and 2023 peaks, while the cheaper streets of Southchurch are setting new highs. The growth in this market is at the affordable end.
At street level, PropertySolvers puts the most expensive addresses at Seymour Road in Westcliff-on-Sea (average sold price £1,380,000), Lodwick in Shoeburyness (£1,235,000), Eastwood Road in Leigh-on-Sea (£1,234,375), Chalkwell Avenue (£1,197,500) and Burges Road on Thorpe Bay’s Burges estate (£1,185,000). By postcode sector, Plumplot puts the dearest patch at SS1 3 (Thorpe Bay), averaging £597,000, and the cheapest at SS0 7 on the inland side of Westcliff, averaging £258,000. Same city, more than double the price.
How Southend compares
| Area | Average price | Annual change |
|---|---|---|
| Southend-on-Sea | £328,383 | +1.6% |
| East of England | £337,518 | +0.5% |
| England | £293,479 | +1.1% |
| United Kingdom | £272,611 | +1.4% |
Sources: Southend, East of England, England and the UK House Price Index browser.
In plain terms, Southend costs about £35,000 more than the England average but around £9,000 less than the East of England as a whole, and it is growing faster than both over twelve months. The pull is no mystery: the seafront, and two direct train lines into London from stations across the city, keep commuter demand underneath prices. On affordability, Plumplot puts the median Southend price at 7.8 times median earnings (2024), slightly worse than the England and Wales figure of 7.54.
Frequently asked questions
What is the average house price in Southend?
The average home in Southend-on-Sea sold for £328,383 in July 2026, according to the provisional UK House Price Index built from HM Land Registry sales. Twelve-month averages of raw sale prices run higher, at roughly £373,000 to £382,000, because big detached sales pull them up.
Are Southend house prices going up or down in 2026?
Both, depending on the window. Prices are 1.6% higher than July 2025, and up 1.0% on June, but the average is still £2,617 below its February 2026 figure of £331,000. Houses are rising and flats are not: detached, semi-detached and terraced homes all gained over the year, while flats and maisonettes fell 0.8%.
How much does a house cost in Leigh-on-Sea?
The average sold price in Leigh-on-Sea over the year to April 2026 was about £442,028, with semi-detached homes averaging £485,537 (Rightmove). That is roughly £130,000 above the central Southend average.
Where is cheapest to buy in Southend?
Southchurch is the cheapest named area, averaging £313,875, and the inland Westcliff postcode sector SS0 7 is the cheapest sector at around £258,000 (Plumplot). Flats citywide average £198,797.
Where are the most expensive homes in Southend?
Thorpe Bay has the highest area average at £584,903, and the priciest streets include Seymour Road in Westcliff, Lodwick in Shoeburyness and Chalkwell Avenue, all averaging around £1.2 million or more (PropertySolvers).
Where can I check what a specific house sold for?
Every completed sale in England and Wales is public. Look up any street or address free on the HM Land Registry sold price search, or browse the same data on Rightmove and Zoopla.
Sources
- UK House Price Index, Southend-on-Sea (ONS / HM Land Registry) for the headline average, property types and buyer types.
- UK HPI Southend data, July 2026 (Land Registry open data) for exact figures.
- UK House Price Index browser (HM Land Registry) for the UK, England and East of England comparisons.
- Our report on the July 2026 figures for the Essex district ranking.
- Rightmove sold prices for Thorpe Bay, Chalkwell, Leigh-on-Sea, central Southend and Southchurch.
- Plumplot Southend-on-Sea house prices for postcode sectors and affordability.
- PropertySolvers Southend house prices for the most expensive streets.
- HM Land Registry sold price search to check any individual address.
Figures are provisional and revised as more sales complete. Always confirm the latest numbers against the linked HM Land Registry and ONS sources before making a decision. Last checked 19 September 2026.
Have your say