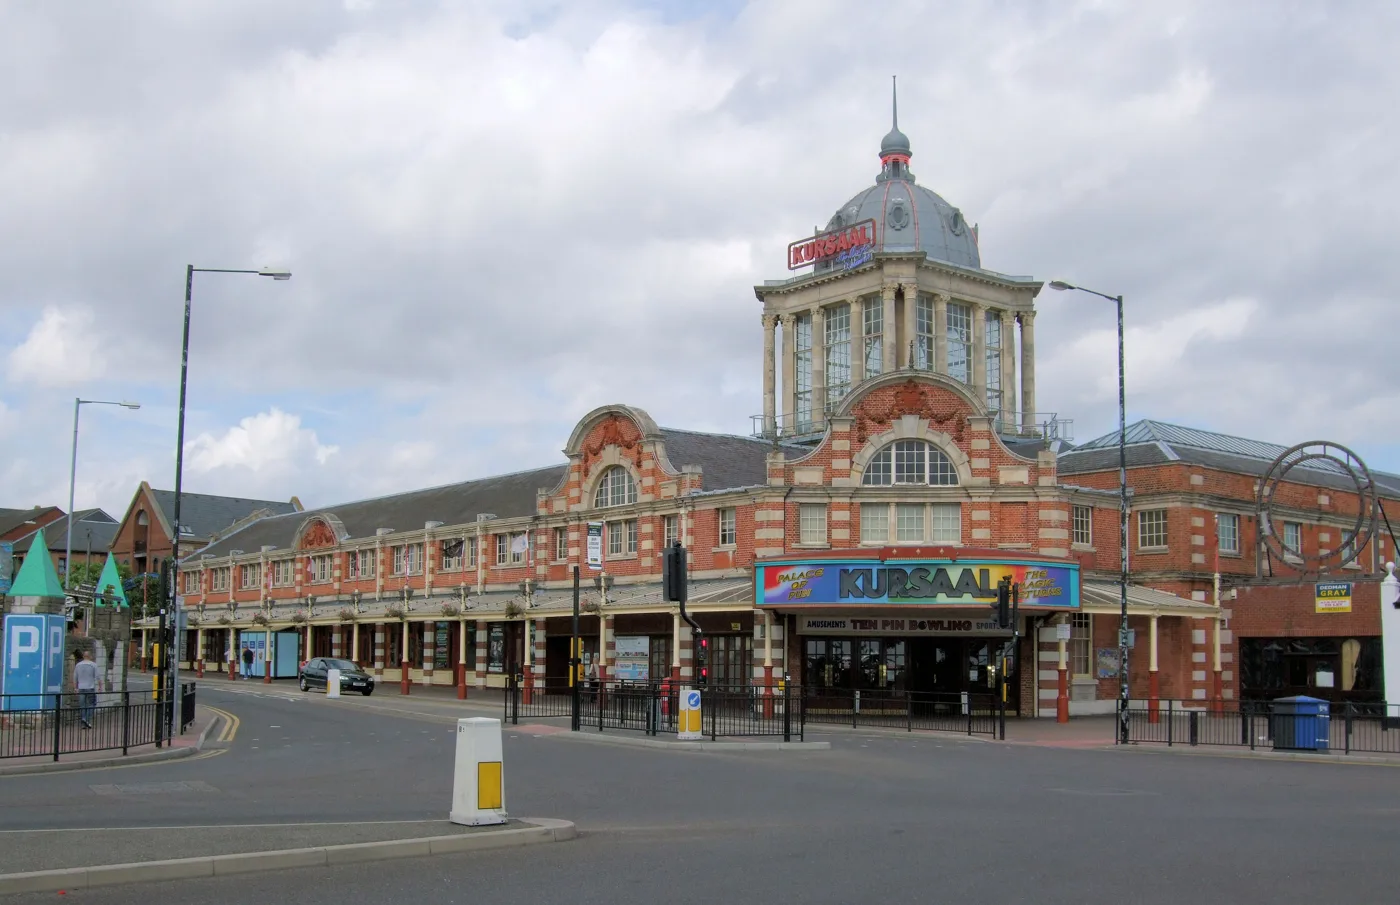

Southend's July claimant count is 4,775, 4.2% of working-age residents. Kursaal is at 8.3% and West Leigh at 1.3%, a six-fold gap inside one city.
4,775 people in Southend were claiming unemployment-related benefits in July, 4.2% of everyone of working age. That is the lowest the city’s total has been since September 2025, and it has barely shifted in a year: 4,740 were claiming in July 2025, so the figure is up by 35, or 0.7% (claimant count, ONS via nomis).
The steadiness of that headline hides a city split down the middle. Ward-level figures published in the same release put Kursaal at 8.3% and West Leigh at 1.3%. A working-age adult in the ward around the seafront amusements is more than six times as likely to be claiming as one three miles west in Leigh.
Every Southend ward, ranked
Ward totals are only available on the current boundaries from January 2026, so the change column covers six months rather than a year. The Office for National Statistics rounds every ward figure to the nearest five, which makes the small wards look jumpier than they are.
| Ward | Claimants, July 2026 | % of 16-64s | Change since January |
|---|---|---|---|
| Kursaal | 700 | 8.3% | -45 |
| Milton | 595 | 7.1% | -20 |
| Victoria | 605 | 6.4% | +5 |
| Westborough | 410 | 5.2% | 0 |
| West Shoebury | 245 | 4.2% | -5 |
| Shoeburyness | 295 | 4.1% | +20 |
| Chalkwell | 255 | 4.1% | +10 |
| St Luke’s | 295 | 4.0% | +10 |
| Blenheim Park | 235 | 3.5% | +15 |
| Prittlewell | 220 | 3.2% | -10 |
| St Laurence | 195 | 3.1% | +10 |
| Southchurch | 185 | 3.1% | -30 |
| Leigh | 145 | 2.2% | 0 |
| Belfairs | 110 | 2.1% | +5 |
| Thorpe | 100 | 2.1% | 0 |
| Eastwood Park | 110 | 2.0% | -5 |
| West Leigh | 75 | 1.3% | -15 |
Three of the seventeen wards, Kursaal, Milton and Victoria, account for 1,900 of the city’s 4,775 claimants between them. That is 40% of Southend’s total from three adjoining wards in the centre.
Southend against its neighbours
Southend’s 4.2% is above the England figure of 4.0% and well clear of the East of England, where 3.3% of working-age residents are claiming. Against the districts it borders, the contrast is sharper still.
| Area | Claimants, July 2026 | % of 16-64s |
|---|---|---|
| Southend-on-Sea | 4,775 | 4.2% |
| Thurrock | 5,015 | 4.3% |
| Basildon | 4,620 | 3.8% |
| Castle Point | 1,305 | 2.5% |
| Rochford | 1,230 | 2.3% |
| Essex (county area) | 29,335 | 3.1% |
| East of England | 131,670 | 3.3% |
| England | 1,482,670 | 4.0% |
Rochford and Castle Point begin at Southend’s own boundary, and both sit at little more than half the city’s rate. What has changed over the year is the direction of travel. Essex’s claimant count rose 5.3% in twelve months and the East of England’s rose 2.9%, while Southend’s rose 0.7%. The city is not getting worse. The county around it is catching up.
What the number does and does not measure
The claimant count is not the unemployment rate. It counts people claiming Universal Credit or Jobseeker’s Allowance who are required to look for work, and that includes people who already have a job but are on low enough earnings to be told to seek more hours. It excludes anyone out of work who is not claiming, or who is claiming on health grounds without a work-search requirement. The ONS publishes it as an experimental series for exactly that reason.
It is still the only monthly measure that goes down to ward level, which is why it is worth reading street by street rather than as a single city figure.
What it means for you
- If you are claiming and looking for work, Southend’s Jobcentre Plus and the council’s employment support are the routes to advisers. The council also runs a cost of living support hub listing crisis grants, food support and help with fuel bills.
- If you are on a low income, council tax reduction is a separate scheme from Universal Credit and is not applied automatically: you have to claim it from the council. Our guide to Southend council tax bands explains what the full bill looks like first.
- If you are watching the housing debate, these ward figures matter to it. The Section 106 package on the 2,000-home Bournes Green Chase scheme includes a minimum 15% local labour during construction and a £30,000 employment and training contribution.
- The next release is due in September, covering August. We will report the ward figures each month.
Have your say